“All organizations are perfectly designed to get the results they are now getting. If we want different results, we must change the way we do things.” ~ Tom Northup
Modern project management is more than a series of boxes to check — it’s about leveraging data and analytics to make smarter decisions, track progress, and improve performance.
Project management analytics and metrics create a powerful, data-driven toolkit for project managers to accurately track progress, evaluate performance, and guide decision-making. Deep data analytics provide unprecedented visibility into a project’s health, allowing project managers to anticipate problems and take corrective action quickly.
But with all the data points available, how do you decide which ones to keep an eye on? Below we’ll cover what project management analytics are, the key role they play, and the seven most important metrics every project manager should track.
7 important project management analytics and metrics
Understanding project management analytics

Managing a project means balancing different demands on your agency’s budget, timeline, and resources. It’s important to have complete visibility into the project lifecycle to assess the current project state, anticipate future risks, and make strategic adjustments.
Project management analytics are numerical data points that deliver a snapshot of the project’s health and performance. They provide a detailed overview of all aspects of the project, including cost, timeline, resource utilization, quality control, and risk management.
Analyzing these data points reveals underlying trends and relationships within datasets. This allows you to quickly identify key drivers of success, potential weak spots or bottlenecks, and areas where you can optimize your project management methodology.
Here is how analytics influence decision-making to improve project success:
Forecasting: Modern project management tools leverage artificial intelligence, predictive analytics, and advanced machine learning algorithms to accurately forecast future project performance. This helps you make data-driven decisions about resource allocation, scheduling, and budgeting.
Risk mitigation: Budget overruns, timeline delays, and resource constraints are some of the biggest risks in project management. Analytics makes identifying, assessing, and mitigating risks easier, allowing you to take corrective action before the damage is done.
Visualization and reporting: Analytics tools provide powerful visual dashboards, charts, and graphs to help you quickly grasp the key performance metrics at a glance. This allows for better reporting and communication between stakeholders and project teams.
The role of metrics in project management
Project management metrics are specific key performance indicators (KPIs) used to quantify, measure, and track the progress of a project throughout its lifecycle. Typical project management metrics include budget, timeline, deliverables, resource utilization, and quality control.
Tracking these metrics allows you to monitor project progress, evaluate performance, and make strategic decisions about resource allocation, scheduling, and budgeting. For instance, tracking the timeline metrics reveals whether you’re on track to meet deadlines, while budget metrics indicate if there’s a need for additional funding. You can then make adjustments to your plan or budget accordingly.
7 Important project management analytics to monitor
There’s no one-size-fits-all approach to project management analytics — your metrics may vary depending on the size and scope of your project and its specific goals and objectives. But these seven essential project management metrics will be relevant for virtually any project.
1. Time-tracking metrics

Time-tracking metrics measure project progress, productivity, and efficiency in terms of timeline. They provide a detailed breakdown of how the team members spend their time, how long tasks typically take, and whether the project is on track. These metrics include:
Actual time vs. estimated time
Task completion rate
Time spent on each task
Milestones achieved
On-time delivery rate
Significance
Tracking time metrics improves accountability, enhances team productivity, and helps you adjust timelines and allocate resources accordingly. You can identify potential timeline bottlenecks or delays early on and adjust tasks or workflows to stay on track.
How to measure
You can measure time-tracking metrics using project management software, timesheets, Excel spreadsheets, or task-specific tracking tools. These tools make it easier to track and visualize progress in real time with dashboards, charts, and graphs.
2. Cost management metrics
Cost management metrics measure the project budget, expenses, and resource utilization. They provide visibility into the project’s financial health, helping you stay within budget and avoid overspending. These metrics include:
Total budget vs. actual cost
Return on investment (ROI)
Cost variance
Cost performance index
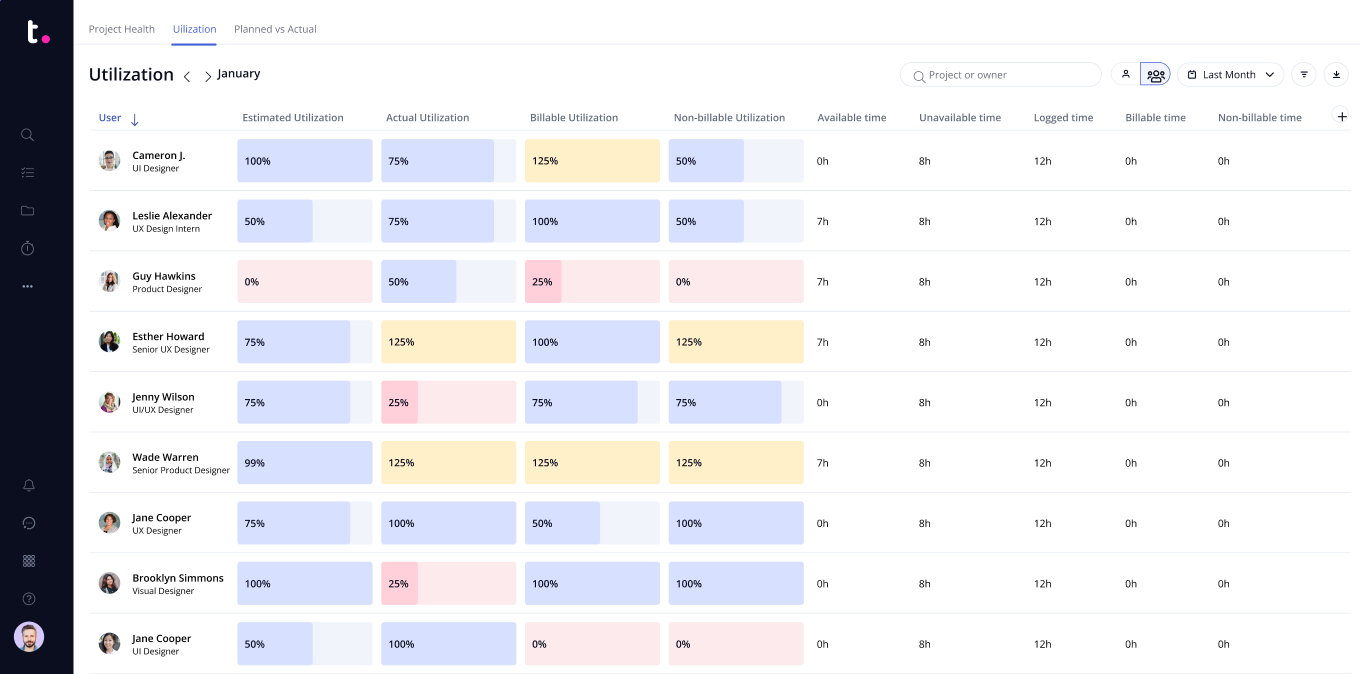
Resource utilization rate

Bye-bye burnout and hello efficiency
See who has capacity to take on more work, quickly assign tasks to the right people, and ensure no one is overburdened. Get a holistic view into your team's workload with Teamwork.com.
Significance
Cost management metrics help project managers justify budget requests, monitor expenses, and adjust spending patterns as needed. They also provide insights into resource utilization and help optimize processes to ensure greater efficiency and cost savings for complex projects.
How to measure
You can measure cost management metrics using agile project management software, budgeting tools, or accounting software. Track project expenses in real time and generate detailed reports for better visibility into the project’s financial health.
3. Quality metrics
Quality control metrics measure the accuracy, reliability, and consistency of deliverables for better project outcomes. These metrics help you identify potential quality issues and take corrective action promptly, ensuring high-quality work and greater customer satisfaction. Standard quality control metrics include:
Defect rate
Mean time to repair
Cost of quality
Customer satisfaction rate
Net promoter score
Significance
Quality control metrics help you maintain quality standards, improve customer satisfaction, and prevent costly revisions and delays. They also provide a benchmark to measure actual performance against the expected standards and identify areas of improvement.
How to measure
You can measure quality control metrics using project management software, customer feedback surveys, and performance tracking tools. Automation enables you to set quality checks at key milestones and quickly detect any deviations from the predetermined standards.
4. Risk and issue metrics
Risk and issue metrics measure potential risks, threats, and issues that could affect project performance. They provide visibility into potential roadblocks and help you proactively anticipate, identify, and manage risks before they affect the project. These metrics include:
Risk exposure
Probability of occurrence
Severity index
Number of risks or issues identified
Average time to resolve issues
Cost of risk management
Significance
Think of risk and issue metrics as an early warning system that helps you identify potential risks before they derail your project. You can use these metrics to activate risk management plans, prioritize risks according to severity, and optimize processes to mitigate risk.
How to measure
Business intelligence (BI) tools, project management software, and risk management software are all useful tools for tracking risk and issue metrics. Their predictive models and analytics capabilities streamline risk management. Set thresholds and parameters for each metric, identify potential risks or issues in real time, and take corrective action promptly to avoid delays and cost overruns.
5. Team performance metrics
Team performance metrics measure collaboration, productivity, and morale, helping managers track employee engagement levels and develop initiatives to optimize workflows for better performance. Team performance metrics include:
Team velocity
Cycle time
Burndown
Communication index
Collaboration index
Absenteeism

Communicate beautifully
Teamwork Chat keeps teams productive by seamlessly integrating into the full Teamwork.com platform. Instant face-to-face or team video chat features keep the human touch while dedicated chat channels reduce unnecessary meetings and emails.
Significance
Team performance metrics are essential for managing team dynamics and optimizing workflows. They help you assess employee performance, identify collaboration gaps, and measure team initiatives’ impact on productivity and morale.
How to measure
Tracking team performance metrics requires a combination of qualitative and quantitative data. You can use employee surveys, performance tracking tools, and project management software to gather information about individual performance, collaboration, and communication. From this data, you can measure team velocity, cycle time, and burndown metrics and take the necessary measures to boost productivity and morale.
6. Scope management metrics

You need visibility into the project scope to assess progress, adjust timelines, and allocate resources accordingly. Scope management metrics measure the project scope against predetermined parameters like budget, timeline, and deliverables. These metrics include:
Scope creep index
Change request rate
Resource utilization ratio
Delivery accuracy rate
Percentage of scope complete
Significance
Scope management metrics provide visibility into the actual scope of the project and the level of progress made over time. They deliver insights into scope creep, change requests, and resource utilization — enabling managers to adjust timelines, allocate resources effectively, and stay on track.
How to measure
You can measure scope management metrics using project management software, budgeting tools, and task-tracking systems. Track timelines, milestones, and deliverables in real time to ensure project completion within the predetermined scope. Automate change request processes to detect scope creep, optimize resource utilization, and prevent schedule delays.
7. Stakeholder metrics
The final piece of the project management puzzle is understanding stakeholder expectations. Stakeholder metrics measure customer satisfaction, engagement levels, and overall experience with the project. They are your agency’s go-to metrics for building customer loyalty, improving customer satisfaction, and driving agency growth. Typical stakeholder metrics include:
Customer satisfaction score
Net promoter score
Engagement rate
Retention rate

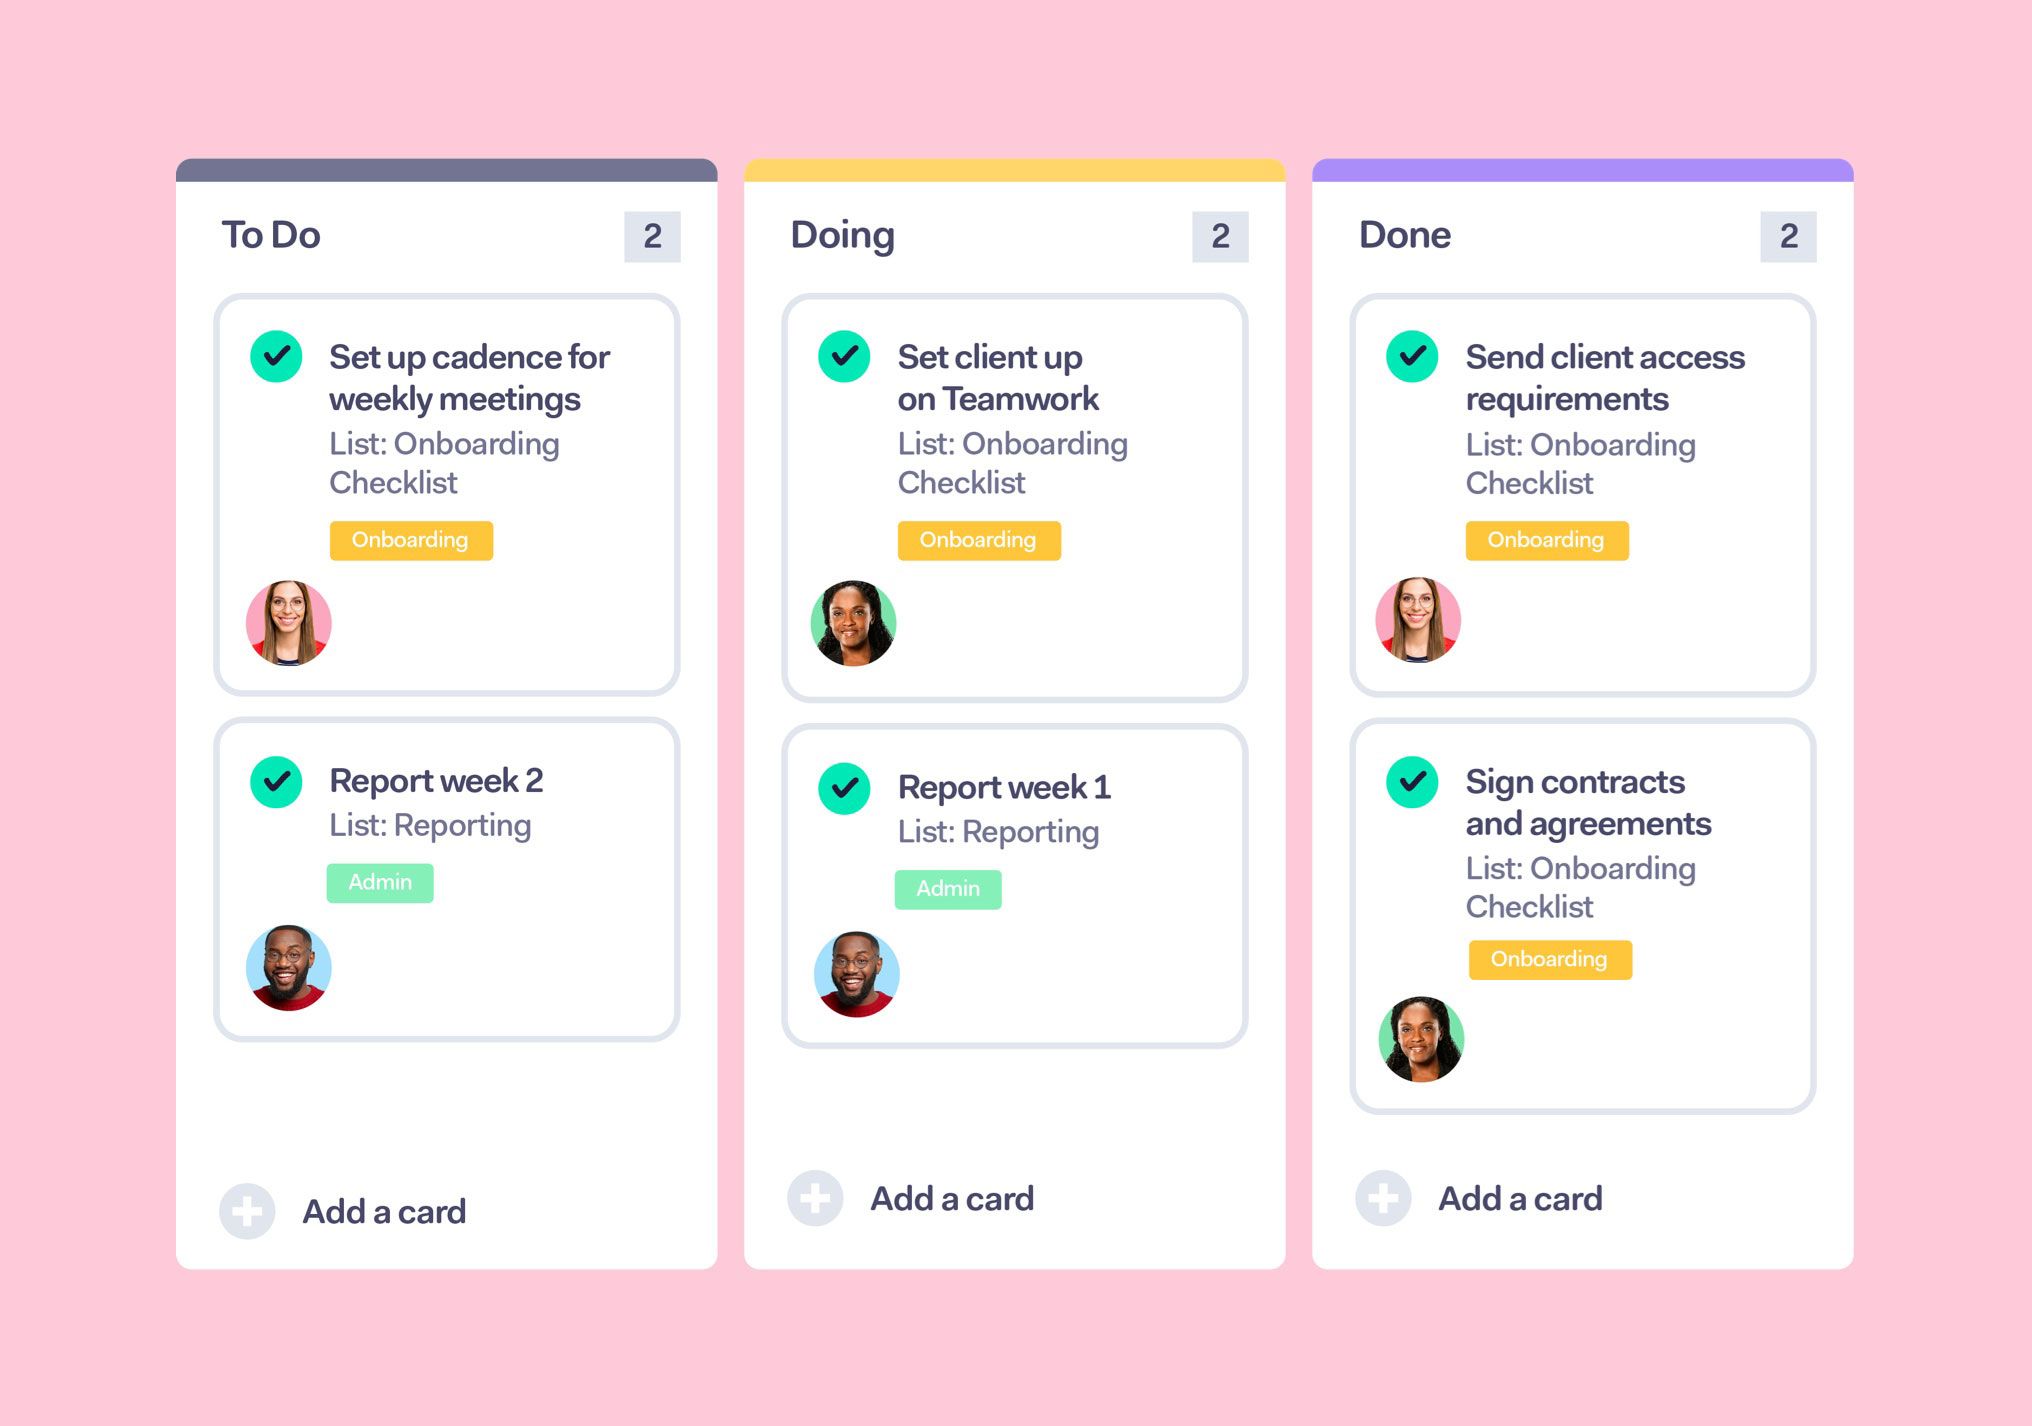
Client onboard checklist template
Start your client relationship the right the way by providing a thorough, professional and friendly new client onboarding experience.
Significance
Stakeholder metrics are essential for understanding the customer experience and building loyalty. They provide insights into customer feedback, preferences, and engagement levels that you can use to implement customer-centric strategies and approaches.
How to measure
You can measure stakeholder metrics by conducting customer feedback surveys, interviews, and focus groups. Ask them to rate various project aspects, such as the quality and timeliness of deliverables, customer service, and overall experience. Then analyze this data to determine customer satisfaction scores, net promoter scores, and engagement rates.
Project management done right with Teamwork.com
Project management analytics and metrics are essential for improving project performance, managing risks, optimizing workflows, and understanding customer expectations. Data analysis and predictive models enable you to track project metrics in real time, detect issues quickly, and take prompt corrective action.
Teamwork.com’s suite of project management tools provides powerful analytics and insights that help you track metrics, streamline workflows, and drive project performance. Our intuitive dashboards, analytics capabilities, and automated processes simplify efficient and effective project management.
With real-time visibility into project progress, you can accurately track metrics, assess risks, and identify opportunities for improvement.
Sign up for Teamwork.com today and see how analytics and data-driven insights can power up your agency’s project management!


